Auckland Volcanoes New Zealand
The Auckland volcanic field has 53 cones, many protected as nature reserves. Since the 2000s, restoration programmes (invasive species removal, native replanting, predator control) have been implemented under the Tāmaki Makaurau Restoration Plan.
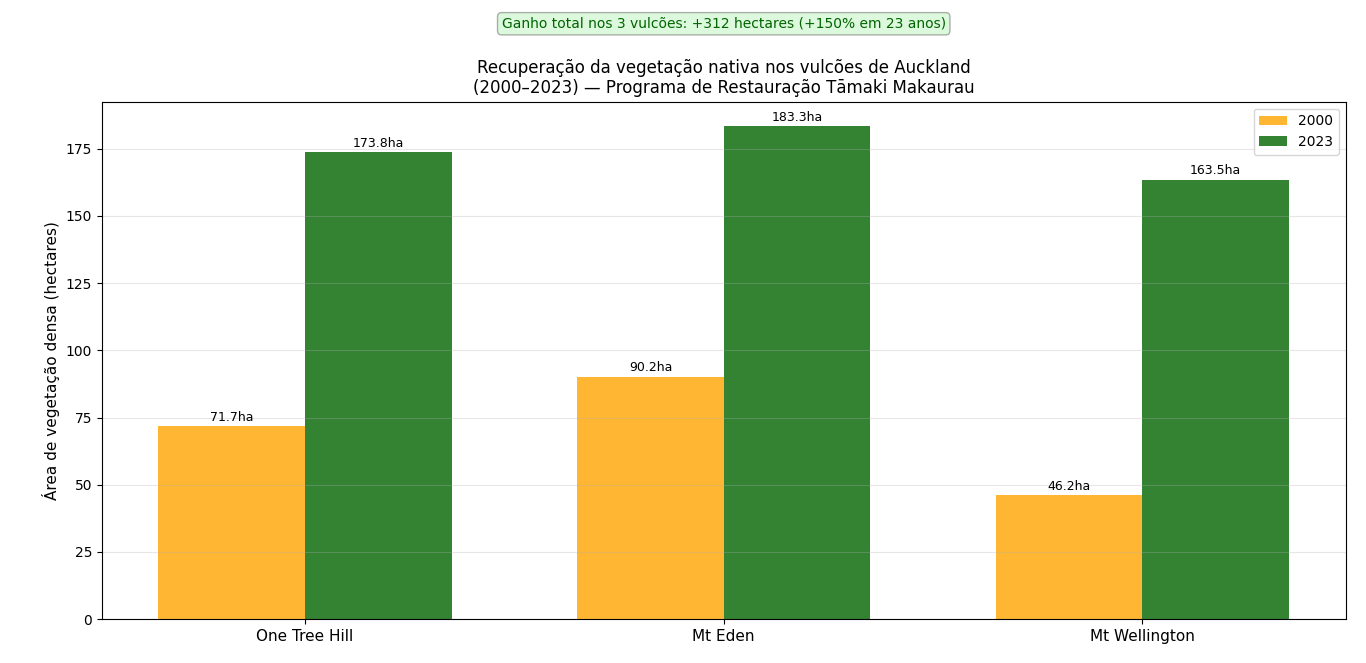
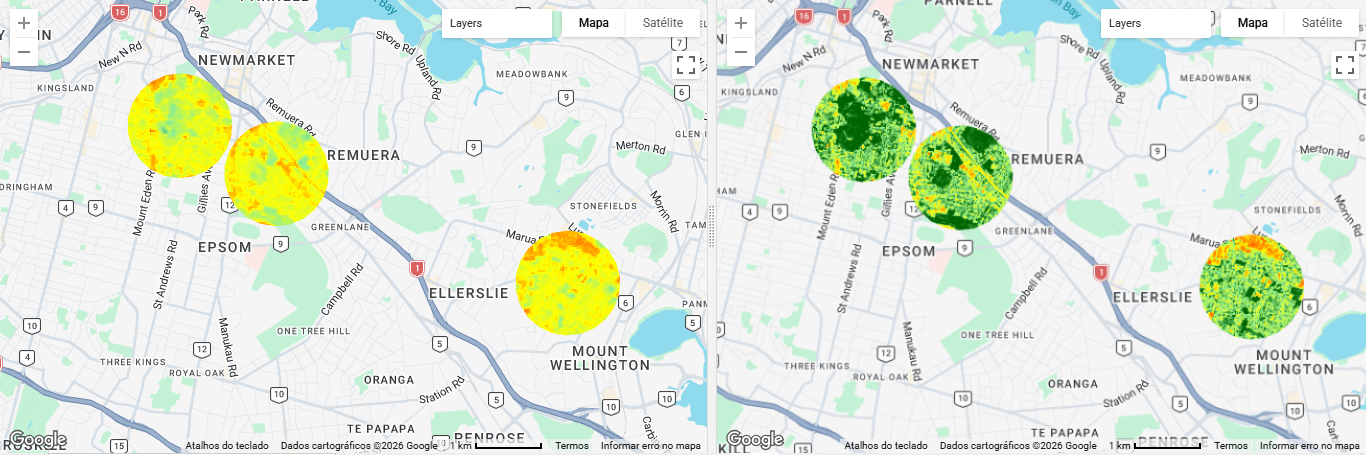
This study analyses three volcanoes with documented restoration programmes: One Tree Hill/Maungakiekie, Mt Eden/Maungawhau and Mt Wellington/Maungarei. It quantifies the recovery of vegetation cover between 2000 and 2023.
Research question
Did native vegetation on Auckland’s volcanoes increase between 2000 and 2023 as a result of the restoration programmes?
Methodology
- Platform: Google Earth Engine
- Imagery: Landsat 5 TM (2000), Sentinel-2 MSI (2023)
- Three volcanoes: One Tree Hill/Maungakiekie, Mt Eden/Maungawhau, Mt Wellington/Maungarei
- 800 m buffer per cone; NDVI threshold 0.2; area via pixelArea
Results
| Volcano | 2000 (ha) | 2023 (ha) | Gain (ha) | Increase |
|---|---|---|---|---|
| One Tree Hill / Maungakiekie | 71.7 | 173.8 | +102.1 | +142% |
| Mt Eden / Maungawhau | 90.2 | 183.3 | +93.1 | +103% |
| Mt Wellington / Maungarei | 46.2 | 163.5 | +117.3 | +254% |
| Total | 208.1 | 520.6 | +312.5 | +150% |
Mt Wellington recorded the largest proportional increase (+254%), coinciding with the start of the intensive restoration programme in the reserve. The total gain of 312.5 hectares in 23 years represents one of the most significant urban native vegetation recoveries in Oceania.
Limitations
Comparison between sensors of different resolution (Landsat 30 m / Sentinel 10 m). The NDVI threshold does not distinguish native species from invasive ones: confirming recovery of specific native vegetation requires field validation. iNaturalist component under development.
View code — Three volcanoes, 2000/2023 comparison (Google Earth Engine)
// GEE — Auckland volcanoes, side-by-side comparison
Map.setOptions('SATELLITE');

var oneTreeHill = ee.Geometry.Point([174.7833, -36.8833]).buffer(800);
var mtEden      = ee.Geometry.Point([174.7667, -36.8767]).buffer(800);
var mtWellington= ee.Geometry.Point([174.8333, -36.8983]).buffer(800);

function getNDVI(col, bounds, nirBand, redBand, start, end, cloudField, cloudMax) {
  return col.filterBounds(bounds).filterDate(start, end)
    .filter(ee.Filter.lt(cloudField, cloudMax)).median().clip(bounds)
    .normalizedDifference([nirBand, redBand]);
}

var l5 = ee.ImageCollection('LANDSAT/LT05/C02/T1_L2');
var s2 = ee.ImageCollection('COPERNICUS/S2_SR_HARMONIZED');
var pixArea = ee.Image.pixelArea();
function calcArea(ndvi, geom, scale) {
  return pixArea.mask(ndvi.gt(0.2)).reduceRegion({
    reducer: ee.Reducer.sum(), geometry: geom, scale: scale
  });
}

var oth00 = getNDVI(l5, oneTreeHill, 'SR_B4','SR_B3','1998-01-01','2003-12-31','CLOUD_COVER',20);
var oth23 = getNDVI(s2, oneTreeHill, 'B8','B4','2022-01-01','2023-12-31','CLOUDY_PIXEL_PERCENTAGE',10);

print('One Tree Hill 2000:', calcArea(oth00, oneTreeHill, 30));
print('One Tree Hill 2023:', calcArea(oth23, oneTreeHill, 10));
View code — Comparative chart (Python)
# Python — Auckland comparative chart
import matplotlib.pyplot as plt
import numpy as np

volcanoes = ['One Tree Hill', 'Mt Eden', 'Mt Wellington']
area_2000 = [71.7, 90.2, 46.2]
area_2023 = [173.8, 183.3, 163.5]
x = np.arange(len(volcanoes)); width = 0.35

fig, ax = plt.subplots(figsize=(10, 6))
b00 = ax.bar(x - width/2, area_2000, width, label='2000', color='orange', alpha=0.8)
b23 = ax.bar(x + width/2, area_2023, width, label='2023', color='darkgreen', alpha=0.8)
ax.set_ylabel('Dense vegetation area (hectares)')
ax.set_title('Native vegetation recovery on Auckland volcanoes (2000–2023)')
ax.set_xticks(x); ax.set_xticklabels(volcanoes); ax.legend(); ax.grid(True, alpha=0.3, axis='y')
plt.tight_layout()
plt.savefig('grafico_vulcoes_auckland.png', dpi=300, bbox_inches='tight')
plt.show()