Bom Jesus dos Passos
The Island of Bom Jesus dos Passos (~2 km², 12°57’S 38°37’W) is home to a traditional community of fishers and shellfish gatherers. The mangrove that borders it is a Permanent Preservation Area protected by the Brazilian Forest Code (Law 12,651/2012). Between 2000 and 2023, urban interventions — promenades, retaining walls, jetties — impacted the ecosystem. The Federal Public Prosecutor’s Office (MPF) documented more than 125,000 m² of impacted protected area.
Research question
What was the change in dense vegetation cover on the island between 1990 and 2023, and to what extent does it coincide with the destruction documented in law?
Methodology
- Platform: Google Earth Engine
- Imagery: Landsat 5 TM (1990–2010), Landsat 8 OLI (2015), Sentinel-2 MSI (2021–23)
- Median composite, cloud filter (Landsat <30%, Sentinel <20%), dry season
- NDVI = (NIR − Red)/(NIR + Red); threshold 0.2 (Landsat) and 0.4 (Sentinel)
- Time series: 1990, 1995, 2000, 2005, 2008, 2010, 2015, 2021–23
- Binary change detection 1990 vs. 2021–23
- Supervised Random Forest classification (50 trees, 5 classes) for the 2021–23 composite
Results
mapa_ndvi_bom_jesus.png
mapa_classificacao_bom_jesus.png
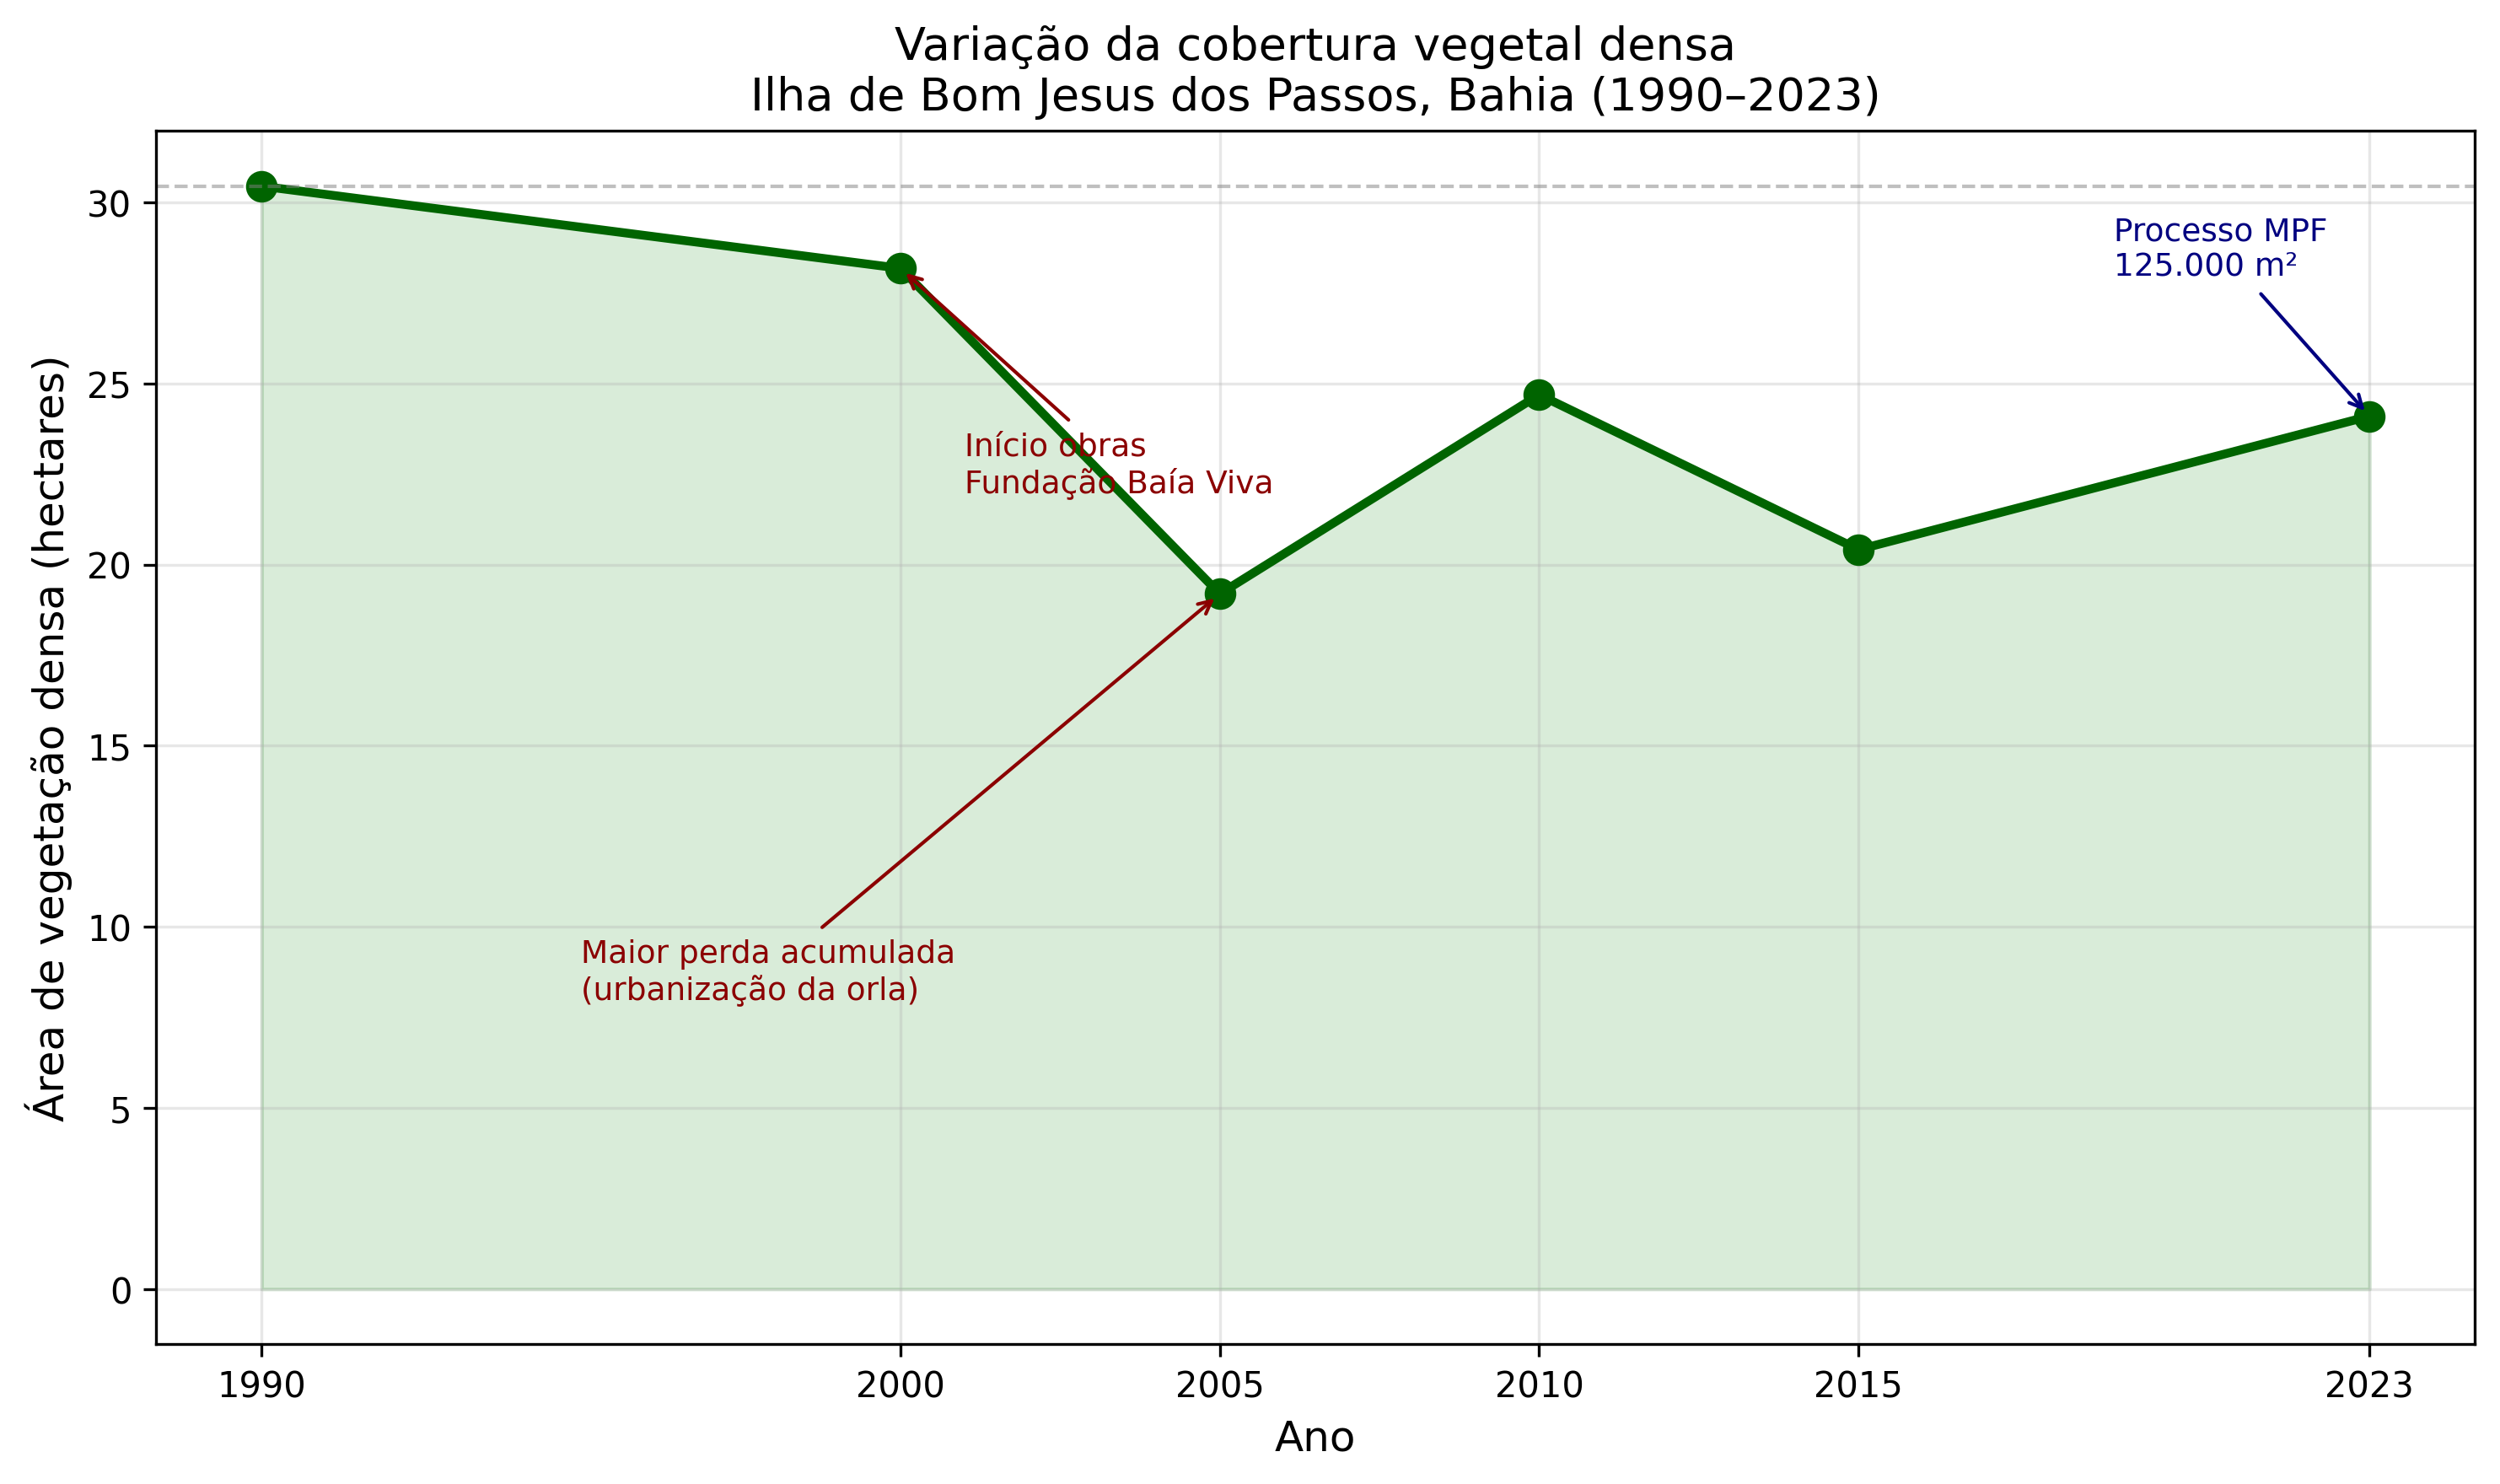
| Year | Area (ha) |
|---|---|
| 1990 | 30.4 |
| 1995 | 26.8 |
| 2000 | 28.2 |
| 2005 | 19.2 |
| 2008 | 21.9 |
| 2010 | 24.7 |
| 2015 | 20.4 |
| 2021–23 | 24.1 |
Net loss 1990 to 2021–23: 6.3 hectares (approximately 20% of the initial cover). Mangrove classified in the 2021–23 composite: 9.3 hectares. Change detection shows loss concentrated at the south-eastern coastal edges (Rua do Brito); vegetation gain in the interior indicates replacement of native ecosystem by anthropic cover.
Note: the final point of the series corresponds to a Sentinel-2 median composite of the 2021–2023 period, used because of the lack of cloud-free coverage in a single year.
Limitations
Comparison between different sensors (Landsat 30 m / Sentinel 10 m). The NDVI threshold does not distinguish mangrove from other dense vegetation in the time series. Validation against MapBiomas not feasible: resolution insufficient for the island scale. Supervised classification limited to the 2021–23 composite.
View code — Google Earth Engine (JavaScript)
// GEE — Mangroves of Bom Jesus dos Passos
Map.setOptions('SATELLITE');
var area = Ilha; // polygon drawn over the island

function calcularArea(ano, colecao, bandaInfra, bandaVerm, limiar, escala, nuvens, campoNuvem) {
  var foto = colecao
    .filterBounds(area)
    .filterDate(ano+'-06-01', (ano+1)+'-06-30')
    .filter(ee.Filter.lt(campoNuvem, nuvens))
    .median()
    .clip(area);
  var ndvi = foto.normalizedDifference([bandaInfra, bandaVerm]);
  var vegetacao = ndvi.gt(limiar);
  var areaCalc = ee.Image.pixelArea().mask(vegetacao).reduceRegion({
    reducer: ee.Reducer.sum(),
    geometry: area,
    scale: escala
  });
  return areaCalc;
}

var l5 = ee.ImageCollection('LANDSAT/LT05/C02/T1_L2');
var l8 = ee.ImageCollection('LANDSAT/LC08/C02/T1_L2');
var s2 = ee.ImageCollection('COPERNICUS/S2_SR_HARMONIZED');

print('1990:', calcularArea(1990, l5, 'SR_B4', 'SR_B3', 0.2, 30, 30, 'CLOUD_COVER'));
print('1995:', calcularArea(1995, l5, 'SR_B4', 'SR_B3', 0.2, 30, 30, 'CLOUD_COVER'));
print('2000:', calcularArea(2000, l5, 'SR_B4', 'SR_B3', 0.2, 30, 30, 'CLOUD_COVER'));
print('2005:', calcularArea(2005, l5, 'SR_B4', 'SR_B3', 0.2, 30, 30, 'CLOUD_COVER'));
print('2008:', calcularArea(2008, l5, 'SR_B4', 'SR_B3', 0.2, 30, 30, 'CLOUD_COVER'));
print('2010:', calcularArea(2010, l5, 'SR_B4', 'SR_B3', 0.2, 30, 30, 'CLOUD_COVER'));
print('2015:', calcularArea(2015, l8, 'SR_B5', 'SR_B4', 0.2, 30, 30, 'CLOUD_COVER'));
// NOTE: the value labelled "2021–23" uses the Sentinel-2 composite of that period
print('2021-23:', calcularArea(2021, s2, 'B8', 'B4', 0.4, 10, 20, 'CLOUDY_PIXEL_PERCENTAGE'));
View code — Time series (Python)
# Python — dense vegetation time series
import matplotlib.pyplot as plt

anos = [1990, 1995, 2000, 2005, 2008, 2010, 2015, 2023]
areas = [304489, 267845, 281805, 191941, 218987, 246906, 204155, 240993]
areas_ha = [a/10000 for a in areas]

fig, ax = plt.subplots(figsize=(10, 6))
ax.plot(anos, areas_ha, color='darkgreen', linewidth=2.5, marker='o', markersize=8)
ax.fill_between(anos, areas_ha, alpha=0.15, color='green')
ax.axhline(y=areas_ha[0], color='gray', linestyle='--', linewidth=1, alpha=0.5)
ax.set_xlabel('Year'); ax.set_ylabel('Dense vegetation area (hectares)')
ax.set_title('Change in dense vegetation cover\nIsland of Bom Jesus dos Passos, Bahia (1990–2023)')
ax.set_xticks(anos); ax.grid(True, alpha=0.3)
plt.tight_layout()
plt.savefig('grafico_manguezais_bom_jesus.png', dpi=300, bbox_inches='tight')
plt.show()